
This step was initially an exercise in keeping excel up on the screen while watching the lecture video at the same time so I could calculate the ratios as Maria was doing hers for Westfarmers (if there is anyone reading this who hasnt done this step yet, my advice is to go straight to the video and not spend time mucking around trying to do the ratios on your own).
After watching the video, I made up the quick-guide below to help me with my reflections on the ratios. Even so, deciphering the results of the calculations was quite tricky. My firm, Funtastic, has been running at a loss for a few years now, so I was expecting to see a lot of negatives, but I wasnt expecting to see quite so many, or such large ones!
There was one surprise amoung all of the negative percentages, and that was the Asset Management Ratios. Initially I was impressed by these as they looked rather good, with the company halving the number of days inventory was kept prior to sale (over the four year period). Then I remembered that the firm had done some “inventory cleansing”, when I imagine that much of their stock on hand would have been written-off or sold out for much reduced prices. On the other hand, the Total Asset Turnover Ratio was also very good, with these showing continuous improvement over the last four years. This indicated that the firm was using its assets more efficiently, and generating greater revenue for each dollar invested into the firms assets.
I must admit that I havent looked at too many spreadsheets for other students as yet, and those I have looked at have been for firms who were also running at a loss, as I was looking for confirmation that my calculations were ok. So, in comparison to these few other firms, my ratios look similar, but I know that they look quite different to those done for Westfarmers in the lecture video. I expect I will find many variations as I read and provide feedback to other students for step 10.
My main question regarding my firm and the results from calculating the ratios would be “how does this firm continue to operate?”. The Economic Profit Ratio shows that profit margins have been in the negative (loss) for the last four years. They were trending downwards in the three years to 2015, but there was a reason for this… there was considerable impairment to the firms goodwill after the sale in 2014 of one of its subsidiaries, Madman Entertainment. 2016 saw a strong swing back the in the other direction, although they are still a long way from being “back in the black”.
Funtastic Limited_Company Spreadsheet
Questions about specific ratio calculations:
1) Debt/Equity Ratio – The 2016 figure is a negative, which is due to the company making a loss in 2016. Do I leave this figure as a negative? Or change it to a positive so that it is just reflecting a straight “percentage of equity that is funded through debt” (does that even make sense!)?
2) Return on Equity (ROE) – These percentages are really huge and also show as negatives for 2014/15/16. But the calculation for 2013 shows as a normal percentage, so I am guessing that this is all ok…? Just really hard to believe that 2015 shows as -35,916% Why is this company still operating!
| Profitability Ratios | ||
| Net Profit Margin | Net profit after tax/sales | For every $1 of sales, how much am I turning into profit? |
| Return on Assets | Net profit after tax/total assets | For every $1 of total assets, how profitable is the firm? |
| Efficiency (or Asset Management) Ratios | ||
| Days of Inventory | Inventory/av.daily cost of goods sold | No. of days inventory is held (on average) |
| Total Asset Turnover Ratio | Sales/total assets | For every $1 of total assets, how much is turned into sales revenue? |
| Liquidity Ratios | ||
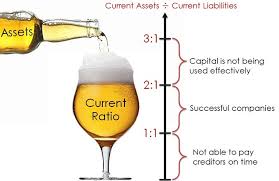
| Current Ratio | Current assets/current liabilities | How well can firm pay its short-term debts? |
| Financial Structure Ratios | ||
| Debt/Equity Ratio | Debt/equity | For every $1 of equity, how much is funded through debt? |
| Equity Ratio | Equity/total assets | How much is equity funded? |
| Debt Ratio | Total liabilities/total assets | How much is debt funded? |
| Market Ratios | ||
| Earnings per Share (EPS) | Net profit after tax/nos of issued ordinary shares | How much profit per (diluted/basic) share on issue? |
| Dividends per Share (DPS) | Dividends/number of issued ordinary shares | |
| Price Earnings Ratio | Market price per share/earnings per share | Compares what you paid for a share, to what it earns you (average is 15-25) |
| Ratios Based on Reformulated Financial Statements | ||
| Return on Equity (ROE) | Comprehensive Income/shareholders’ equity | For every $1 of shareholders equity, what am I generating in profit? |
| Return on Net Operating Assets (RNOA) | Operating income after tax (OI)/net operating assets (NOA) | Compare to ROA |
| Net Borrowing Cost (NBC) | Net fin. expenses after tax/net financial obligations | Net cost of borrowings (interest rate on loans) |
| Profit Margin (PM) | Operating income after tax (OI)/sales | Compare to NPM |
| Asset Turnover (ATO) | Sales/net operating assets (NOA) | Compare to TATO (turning dollar/asset into sales) |
| Economic profit | (RNOA – cost of capital) x net operating assets (NOA) | Negative or positive profit? Why? What is the trend? |
